Ice, Ice Maybe
Glaciers are growing in the Himalayas. What does that mean for climate policy?
Chapter 1
The bleating of sheep and goats being released from their overnight thorn-fringed pens acts as an alarm clock. David Archer opens his eyes slightly and checks his watch. 5:45 a.m.
Sitting up in his sleeping bag, Archer looks down the Basho Valley from his overnight perch at the shepherds’ summer encampment, well above the treeline. He can make out the distant villages in the main valley below and the surrounding clusters of irrigated apricot trees. Above the orchards, dense patches of pine woodlands thin out as the altitude increases to snow-capped peaks reaching over 7,000 meters. Though Archer moved to Pakistan in 2000 and has lived here for a year and a half, the beauty of these valleys tucked into the northeast part of the country still delights him.
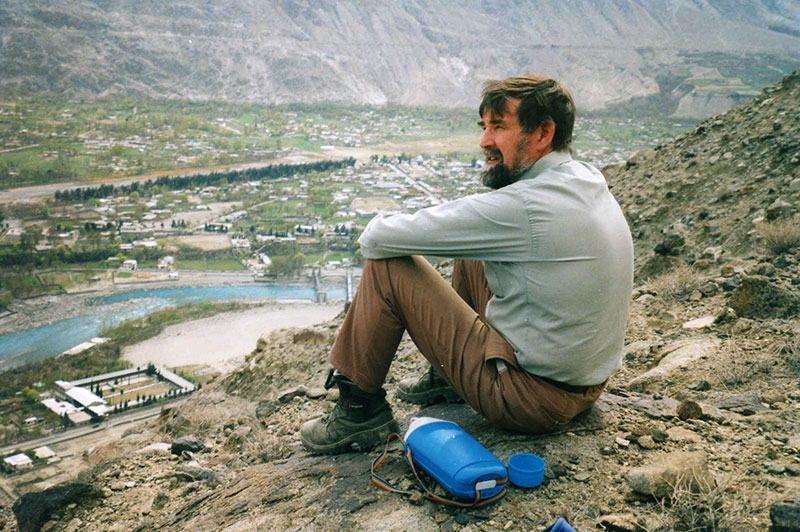
David Archer on Konodass Hill. Image Courtesy of David Archer.
Archer quickly steps into his hiking boots, caked with yesterday’s dust and last night’s chill. He stretches his wiry frame, aching a little from a night on the hard ground and the previous day’s walk. After rolling his sleeping bag up, he takes stock of the supplies in his backpack before stuffing it in. A good supply of local dried fruit and nuts, his blue canteen with the rainbow shoulder strap, and a notebook and pen round out his possessions for this trip.
The shepherds are already frying flat breads, called parathas, in ghee over an open fire. Archer’s guide, seeing his client has stirred, brings over a fresh paratha and lassi yogurt for a quick breakfast as they prepare mentally for the day’s trek.
Soon, they hit the trail up-valley, following the turbid Basho River toward its source. The rock-strewn landscape is broken up by patches of herbs and low shrubs, which provide good summer forage for local flocks of sheep and goats. As the trail ascends higher, though, the patches of greenery become sparser.
The guide, a man in his mid-thirties, with thoughtful eyes looking out beneath a helmet of dark brown hair, talks about the need for education and opportunities for youth in the region. The Basho, a small tributary, tumbles through the Karakoram Mountains until it meets the much larger Indus River, which eventually flows through Pakistan’s agricultural heartland, providing water for over 90 percent of the crops the country produces, chief among them wheat, sugarcane, and cotton. (There’s a good chance the shirt you’re wearing is made with cotton from that region.) In addition, the mighty Indus also turns turbines for hydropower for much of Pakistan.
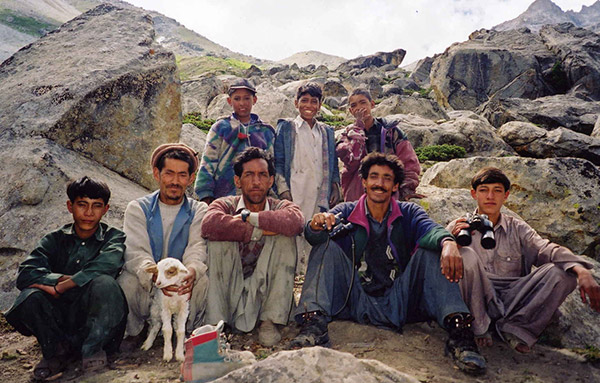
Local shepards during Basho GLOF Study. Image Courtesy of David Archer.
As the men pick their way along the rocky path, Archer’s guide explains that in the upper reaches of the basin, the Indus provides water for agriculture and hydropower on a smaller scale. In fact, Archer’s trip is part of a larger effort to assess the potential risks to hydropower from glacial lake outburst floods, which can have dramatic consequences for people living downstream. Archer is a British hydrologist, based in Newcastle, who, in addition to doing academic research, has spent decades working as a consultant with local and national water authorities around the globe to help them understand flood risks large and small—as he modestly puts it, “finding answers to practical questions.”
A few hours later, the hikers reach their first goal. Archer’s legs are burning as he takes in a breath and looks up at the snout of the Sarfulisa glacier, one of hundreds that cover one of the most heavily glaciated regions of the world, sitting above them around 4,500 meters. A thousand meters above that, the beginnings of the glacier look white and clean, but closer to where Archer and his guide stand, summer runoff has smeared the glacier with a patina of dirt.
Archer casually throws out a question to his guide. “So, how much has this glacier retreated in your lifetime?”
The guide answers without a pause. “It hasn’t really changed at all.”
Small streams of water form braids as they rush down the talus slope to the Basho River below and the Indus below that. Spry for a man in his late fifties, Archer pushes the ache in his legs aside and moves to snap photos and record notes on the state of the landscape around the glacier and the threat of sudden flooding.
After taking photos from afar, Archer works his way up the talus slope toward the dirty ice. At times, the slope becomes steep enough that it requires climbing hand over hand. The tinkle of tumbling rocks meshes with the rush of water as the men get closer to the glacier’s terminus.
Stopping to jot some notes, Archer casually throws out a question to his guide. “So, how much has this glacier retreated in your lifetime?”
The guide answers without a pause. “It hasn’t really changed at all.”
Chapter 2
Although neither Archer nor his guide knew it, this offhand observation would open a whole new field of research for Archer and a collaborator back in Newcastle. The guide’s observation flew in the face of previous work in the Himalayas, which had shown that glaciers were shrinking, as one would expect in a warming world.
The Karakoram region is best known for being home to K2, the second highest mountain in the world, and a cluster of other high peaks. But now, in climate science circles, the region is becoming known as one of the only places on Earth where glaciers aren’t shrinking.
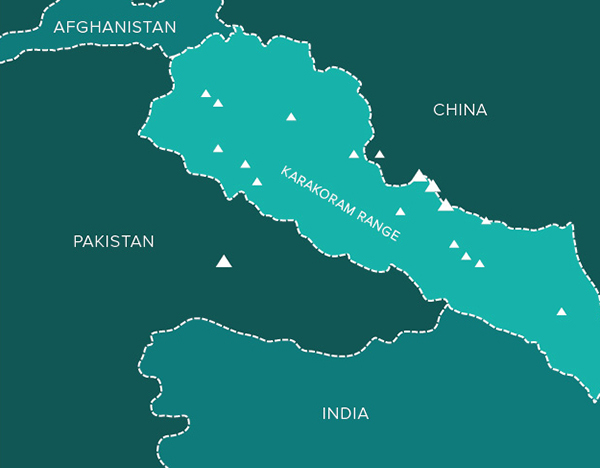
Map showing location of Karakoram Range.
Glaciologist Ken Hewitt has dubbed this phenomenon the “Karakoram Anomaly,” and Archer and other researchers have been studying it for more than a decade in hopes of understanding the causes of the anomaly. The work is particularly important to Pakistan’s burgeoning economy.Meltwater from these glaciers contributes about a quarter of the water in the Indus, which turns turbines for hydroelectric power and provides water to a substantial portion of Pakistan’s cotton fields. What happens to these glaciers, then, has major implications not only for development in the region but also for markets across the globe.
To that end, scientists (including Archer and his collaborators) are using climate models to try to understand what makes the region’s glaciers so unique and to predict whether the glaciers will continue to buck the larger global trend. Unfortunately, their work has also attracted climate skeptics looking for a cheap way to debunk the whole theory of climate change and put the inherent uncertainty of climate models—and, by extension, they argue, the impracticality of climate policy—on full display. As Archer and his collaborators see it, this surprising turn of events couldn’t be more antithetical to the real consequences of their work.
Chapter 3
Archer is a self-described “hydrology guy that can put glaciers in a water context.” In this, he is somewhat unusual; while hydrologists generally study the distribution, movement, and quality of water in its liquid form, Archer is also interested in its icy source. A year after leaving Pakistan to return to Newcastle due to security concerns shortly after September 11, 2001, he grew more interested in using meteorological records to write a broader academic paper tying together glaciers, water, and climate in the upper Indus to provide a clearer picture of the region’s water cycle. But to perform the deeper analysis of the interactions among the three elements, the self-professed “water guy” needed help with the climate part.
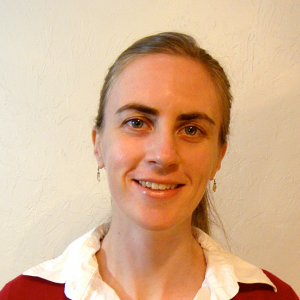
As luck would have it, he found that help the following year during the British Hydrological Society’s annual conference. Entering a banquet dinner, he randomly sat down at a table and introduced himself to the people with whom he would be spending the next few hours. One of them was Hayley Fowler, a climate and hydrology scientist just starting her career at Newcastle University.
Over salad, Archer and Fowler discovered that they shared a common interest in modeling climate and water in mountainous regions. As the entrée was served, Archer explained his work in Pakistan. Fowler was intrigued not only by the case of the stagnant glaciers, but also by a discovery Archer had made in a dusty storage closet during his time in the country.
When Pakistan and India gained independence from British rule in 1947, meteorological records were scattered haphazardly throughout the region. Archer had been working with records kept since 1947, but he knew the older records were still out there somewhere. Having access to them would help him better understand the climate in which the upper Indus glaciers were stagnating.
Archer sought out Pakistan’s chief forecaster for help finding the records. At their first meeting, he noticed a tropical climatology book on the forecaster’s desk. The book had been written by a colleague of Archer’s from thirty years ago, and he offhandedly mentioned the relationship.
That small detail turned a cordial but slightly reserved welcome into a deeper trust-by-association. After Archer explained that he was interested in searching for the missing records, the forecaster pledged to help. They searched the main meteorology agency offices together whenever Archer could make the day-long bumpy bus trip from his post in Gilgit to Lahore.
After the long bus trip, Archer would find his way to the compound housing the meteorological offices. At the front of the compound, a plain white sign with black lettering welcomed visitors to the office. A Doppler radar towered above it, looking like a miniature Epcot Center on top of a pedestal.
Once inside the compound, Archer relied on his guide to show him around. The forecaster knew the ins and outs of offices behind the low-slung cinderblock walls of the compound. The two men poked through filing cabinets, closets, and nooks and crannies throughout the main meteorological office. They found plenty of old papers and artifacts, but not the missing records.
Then one day, they opened a long-neglected storage closet. As the door creaked open, hazy light leaked in on stacks of dusty bound volumes of records that hadn’t seen light in decades. Pulling a few volumes out, the men quickly realized they had found meteorological records not just for the western Himalayas but for much of the Indian subcontinent. Each volume contained six months of temperature readings, going back to the 1890s.
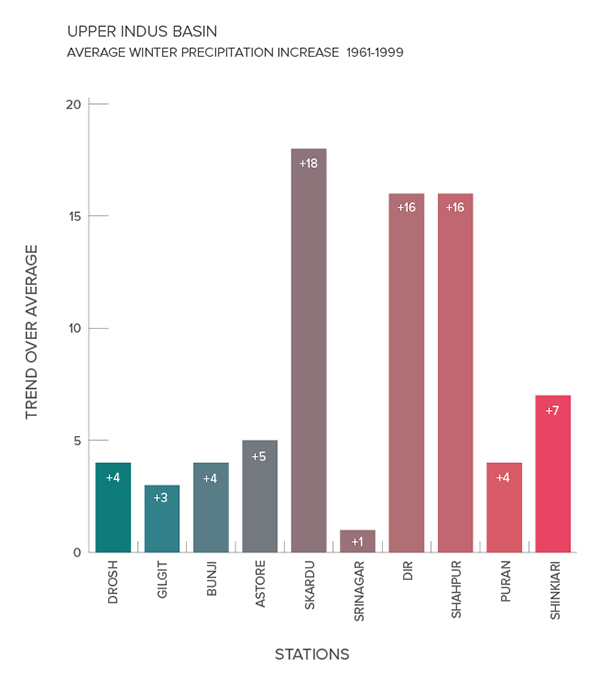
Karakoram Precipitation Graph
Archer was ecstatic. The data was meticulously recorded and ordered, and essentially doubled the climate record for the region. Over the next few months, staff at the meteorological agency offices transferred data from the volumes into a computer form, starting with the areas their colleagues and Archer were most interested in.
As a result, Archer returned to the United Kingdom with an extensive temperature record for the entire region. A few calls to the UK Met Office and a visit to their headquarters in Exeter yielded the precipitation records for the region over the same time period.
As Archer finished the story of the lost-and-found data over dessert, Fowler’s interest was piqued even further. Over coffee, they started to form a plan. Together they planned to examine the climate records and tie them to river flows. From there, if the results were promising, they might even be able to model the future.
The quest was sparked in part by academic interests in modeling one of the most challenging regions of the world, but the results could also provide valuable information to water agencies in the region that would have to deal with the challenges posed by a changing climate It would also lead Fowler to explore the deeper issues surrounding the application of models to policy, and how easily—even willfully—they can be misinterpreted.
Chapter 4
The availability of such extensive data drew Fowler to work with Archer—that, and her love of mountains. In addition to the usual bibliography and CV, Fowler’s faculty web page is dotted with notes and pictures of her hanging off cliffs and standing on summits across five continents. She picked up mountaineering and rock climbing during her PhD studies at Newcastle University in the late 1990s and is just as likely to be on top of a mountain for vacation as for work.Although Fowler’s work just as often involves sitting in front of a computer and crunching data as being out in the field, she sees strong parallels between her work and her hobby.
“I’ve always been interested in problem solving from different aspects; it’s one of the reasons I climb as well,” she says. “I love [my work] because it’s all about solving a problem, which is how to work out the moves to get up a climb.” Climbing is all about problem solving; in fact, the route climbers follow is commonly referred to as just that: a problem needing to be solved.
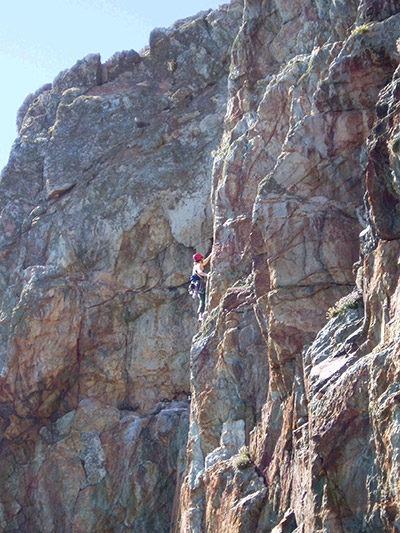
Hayley Fowler leading a climb in Wales. Image Vourtesy of Hayley Fowler.
Climate change has always been an especially intriguing problem to Fowler. “The big thing when I was growing up was if we were going to have a global ice age,” she remembers. “Then it was Greenpeace talking about global warming in the 1990s, when I was going to university.” She wandered further down the path of water and climate science during her master’s studies, looking at rainfall and drought in the Yorkshire region of England. Since then, she has gone on to carve out a career focused on modeling extreme rainfall and translating those model outputs into information that’s applicable beyond her office. In addition to her work in the Indus, Fowler is heavily involved in projects in the UK that use models to help figure out how best to adapt, as she puts it, to the “unavoidable impacts of a changing climate.”
The way these impacts will be felt could differ greatly between the Himalayas and the UK. Once Fowler turned her focus to the Himalayas, she started fresh, poring over the data Archer had acquired and sorting it into spreadsheets; then she turned to working the data through other computer programs capable of running different analyses. She hoped to help determine how glacial runoff patterns are changing as the world warms, so that regions of India and Pakistan can better prepare for changes in their water supply. Her climate expertise helped her quickly find some interesting trends.
In much of the world, temperatures are rising, but the climate of the upper Indus has followed a different pattern of change. During the winter months, the trend is in line with the rest of the world; Fowler’s analysis showed steady winter warming between December and May since 1894, with more rapid warming occurring since 1961. Further decomposing the data, Fowler found winter high temperatures rising faster than winter lows. This change could help explain the growing glaciers; warmer air can hold more moisture, contributing to greater snowfall. And in the high elevations of the Himalayas, even a fairly large increase in temperatures isn’t enough to tip the scales to widespread melting because temperatures are so cold.
The really interesting trends showed up in the summer, though. During that season, temperatures in the upper Indus are actually cooling overall, with nighttime lows dropping faster than their daytime high counterparts. These cooler summer temperatures mean less ice melts in the summer, helping keep glaciers close to equilibrium. It’s one of the few places in the world where this pattern is playing out. (Mount Shasta in California is another one, though the growth of its glaciers is due to more winter snow rather than cooler summer temperatures.) In fact, if you go to the central or eastern Himalayas, just a few hundred miles away, glaciers are receding. In short, the upper Indus has proven to be, in Fowler’s words, a “strange place.”
To find the source of the region’s unusual temperature pattern, Fowler and Archer first need to better understand what’s causing the present climate of the upper Indus to react differently than the rest of the world. They also hope to make a reasonable speculation about whether that trend might continue in the future. To this end, with the
help of a graduate student, they have turned to searching for changes over time in satellite data and to using tools that let them simulate what future climate could look like: climate models.
Simulating future climate is a daunting task. Meteorologist Lewis Richardson, in 1929, came up with a helpful analogy for the complexity of what climate models tackle, observing that “the atmosphere resembled London for in both there were always far more things going on than anyone could properly attend to.” That is to say, predicting every single thing that will happen in London in a day is impossible. Of course, you can predict some things with relative certainty: Big Ben will strike at noon; the guards will change at Buckingham Palace. And you can even make more general predictions—about events in the city that will cause the number of Tube riders to rise or fall on average, or which alternate routes are likely to clog up due to a morning road closure—with some accuracy.
Say, for example, you wanted to know the number of riders who will get off at any given Tube station between 5 and 6 p.m. next Thursday. After doing some research, you might produce a relatively simple model that essentially says, “Take the average number of riders at this station for this time and day of the week, multiply by x if it is raining, add y if it is tourist season, subtract z if there is scheduled track maintenance, and add a percentage of the people who got on at the previous four stops.” If you were to draw a diagram of this simple model, it might look like the Tube map, with arrows from each stop to the four preceding it, and with the average number of riders, weather conditions, and road closures appended to each stop. When next Thursday arrives, you could easily check your prediction against real data, and tweak the model according to developments you learned about that might affect the answer.
But what if you wanted to extend the prediction out to 2040 or forecast the effects of telecommuting by hologram? The buildup of effects over time, both small and large, would make it nearly impossible to make a reasonable forecast decades into the future. To simulate the effects of an entirely new technology on the Tube system, all we have are a basic knowledge of how the current Tube system works and some analogies from the past that may or may not apply to the future. Plus, we know that our model is missing pieces and that the pieces we do have may not be put together in the best way possible. These challenges to modeling the future of the Tube are, in essence, the same as some of the challenges climate modelers face.
Animated GIF showing global model simulation from 2010-2100 by decade.
Modeling the climate, though, is much more complicated. Within a climate model, instead of a two-dimensional map with interconnected stations, the physical world is represented by a three-dimensional grid (with vertical layers of ocean and atmosphere as the third dimension). Stepping into a climate model, like one of Fowler’s, and exploring a region such as the upper Indus would be a radically different experience from Archer’s expedition. The braided rivulets tumbling to form the Basho River, the snow-dusted spires, even the Indus basin’s namesake, the river itself—all of this would be reduced to cubes stretching into the distance, each representing a 125-kilometer by 125-kilometer patch of earth.
The undulating ridges of the Karakoram rising to K2’s lofty summit would be gone, too, replaced by a series of steps reminiscent of the 1980s arcade game Q*bert. The mix of agricultural terraces, temperate forest, and tundra ecosystems would be mowed down and blended into generic slurry.
The sky, too, would be a series of giant stacked cubes; if the models somehow captured the light-refracting patterns, you might see them as shades of blue and white. If the overhead cube was white, it could suddenly turn blue and remain that way until jolting white again. In that time, perhaps a rainstorm has blown through, though without that same electric feeling—only a perfectly flat puddle of accumulated rain, which would jerkily disappear as the model steps forward. The breeze never gusts. Instead, it blows steadily for a few minutes, after which it changes to a different but still constant speed.
The cubes in the model world are related like sets of gears in a watch. Just as the motion of each gear is dictated by that of neighboring gears, after a researcher hits “start” on a climate model, the temperature, precipitation, cloud cover, and behavior of ocean currents in one cube dictate those aspects of neighboring cubes. How each cube influences the others is governed by sets of equations from atmospheric and ocean sciences. But while the motion of gears in a watch can be captured with equations you might find on a high school math test, climate model equations draw from research on atmospheric physics and the flow of turbulent fluids more likely to be found in a PhD dissertation. These equations express, for example, how the temperature on the Earth’s surface influences how quickly water evaporates, which helps determine cloud formation, which, in turn, could shade the surface and bring temperatures down. They shift variables like temperature, wind speed and direction, and humidity every few minutes inside the model world. While some of these numbers are determined by the model, others are set by the user.
Just as the time shown on the face of a clock is determined by the motion and configuration of the gears and the position of the hands when the clock starts running, the output of a climate model is entirely the result of the starting conditions, the parameterizations (or ways that complex phenomena, like cloud formation, are simplified), and the equations that operate on them and carry them forward in time. The mundane task of inputting the starting conditions and parameters—greenhouse gas concentrations, the amount of heat that clouds reflect, how quickly the warm ocean surface churns under—and hitting “start” creates a model world, a stripped-down minimalist translation of the real world.
This climate model might seem crude, but models like it are the product of 120 years of development, enabled largely by vast increases in computer power in the last half of the twentieth century. The first rough climate model, made in the late 1890s by Swedish physicist Svante Arrhenius, was a pen and paper endeavor. Considering its simplicity, it gave predictions of the change in temperature with increased CO2 emissions that agree remarkably with predictions from current models. The nineteenth century also saw the start of better record-keeping, providing invaluable data for current scientists to tune and test their models. One way they do this is to start the models with data up until 1970, say, and observe the accuracy of the models’ predictions of the climate through to the present day. If models can “hindcast” the recent past with a fair degree of accuracy, it stands to reason they should be able to forecast the future with similar accuracy.
The hope is to build a climate model to capture accurately the possible effects of greenhouse gases that affect us—such as more extreme summer temperatures, flooding in some areas, and drought in others—at a local enough scale to be useful.
The evermore complex successors to Arrhenius’s pen and paper effort have been run using computers since the late 1960s. Using these models, scientists can study the effects of climate change, tweaking the atmosphere by raising or lowering greenhouse gas concentrations, say, and observing the domino effect on the results. The equations of the model cannot be solved exactly, but a powerful computer can usually find good approximate solutions—though the process can take days, or even months, if the cubes of the model world are small enough. Even with the constant improvement of computer technology, modelers face a trade-off between fleshing out their models with more details and keeping them small enough to run in a reasonable amount of time.
Initially, these climate models were conceived for long-term weather prediction and simply to sate scientific curiosity about processes in the atmosphere, with no climate policy ends in mind. Since then, and particularly since the late 1980s when global warming became an issue, however, models have become central to the debate about the best path forward to stem rising temperatures and deal with the changes already in the pipeline. The hope is to build a climate model to capture accurately the possible effects of greenhouse gases that affect us—such as more extreme summer temperatures, flooding in some areas, and drought in others—at a local enough scale to be useful. We could use such a model to simulate the effect of imposing a strict limit on greenhouse gas emissions, compared to the effect of a looser limit or imposing no limit at all. A model this accurate would help us decide and debate our future—or might, at least, make the consequences of our inaction clearer. For example, it would let us debate what magnitude of climate change impacts we are willing to cope with in exchange for cheap energy—decreased water availability in regions such as the Indus? Submersion of coastal areas? Tropical disease spread?
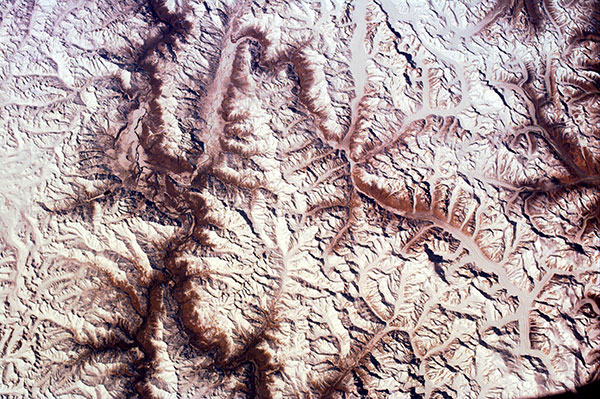
Aerial view of glaciers in the Karakoram range.
Still, while climate models, like the model of the London Tube, can provide a window into processes and relationships within a system, their reliability in predicting specifics—whether a specific tourist group might enter the Tube, say—is much shakier. The models are subject to multiple kinds of uncertainties that extend well beyond the settled question of whether or not human-induced climate change is taking place.
These uncertainties worm their way in at multiple points in the climate modeling process. They start at the root of models, in the available data (or lack thereof) that modelers enter as the starting conditions, and they only accumulate as a model progresses through its steps. Small uncertainties in the structure of a model can throw off predictions in the far future, just as a watch that loses a fraction of a second per day will be accurate enough tomorrow but not in a few years’ time.
But, you might ask, if model predictions are so rife with uncertainties, what role can they have in making climate policy?
It’s a reasonable question—and even experts in the science and policy of climate change can’t agree on the answer.
To take another example, seemingly innocuous clouds pose great challenges to the climate modeling community. A physical cloud, after all, is a complex system in itself. Since clouds tend to be less than a kilometer wide, modeling one with any degree of accuracy is impossible at model resolutions of tens or hundreds of kilometers. The best a climate model can do is represent a cloud as a giant cube in which all of the dynamic processes that occur to create, shape, move, and transform a cloud have to be translated, or parameterized, into a few numbers. Nothing in the world corresponds exactly to these numbers.
Problems like cloud physics are of interest to scientists for their own sake, but they’re becoming increasingly relevant to billion-dollar policy decisions. Government officials and private companies are turning to climate models for clues about what might happen next.
But, you might ask, if model predictions are so rife with uncertainties, what role can they have in making climate policy?
It’s a reasonable question—and even experts in the science and policy of climate change can’t agree on the answer.
Chapter 5
At Carnegie Mellon University in Pittsburgh, there’s a worn black staircase in a building which (according the undergraduate tour guides) Andrew Carnegie planned to turn into a steel mill if the university didn’t work out. The stairway separates the offices of two professors whose views starkly illustrate two sides of the ongoing debate on how to apply the results of climate models to policy. Even more, their disagreement suggests the possibility that no policy problem in history may have truly prepared us to tackle climate change.
At the top of the stairs sits an office that is in the process of being reclaimed by a wilderness of stuff. It belongs to Paul Fischbeck, a professor of Social and Decision Sciences, who studies risks, both rare and everyday. Once or twice a year, a secret admirer sends him a curious artifact that plays to his engineering side; past gifts have included a basketball-sized drill bit from an oil rig, the wing of a small airplane, and a length of train track, all of which Fischbeck has made room for. A chair from a B-52 bomber, his desk chair in his younger days, is now pushed against the wall and piled with papers and assorted plane parts. A Barack Obama commemorative slot machine sits against another wall, opposite bookshelves that play home to antique rapiers as well as books with titles ranging from The Effects of Commuting on Pilot Fatigue to The Manga Guide to Statistics.
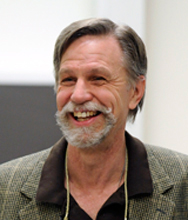
Paul Fischbeck. Image Courtesy of Carnegie Mellon University.
Fischbeck himself sits at the epicenter of his collection of books and artifacts. His graying beard and temples give him a passing resemblance to Nobel economist Paul Krugman, but he still carries himself like the Navy pilot he used to be. Fischbeck’s research on all types of risks to health and safety helps shed light on decisions where competing priorities, such as health and safety, cost, and environmental protection, must be weighed. In the 1990s, he analyzed damage incurred by space shuttle tiles during launches, largely prefiguring the Columbia space shuttle disaster of 2003. Although NASA had followed through on many of Fischbeck’s recommendations, tragically the shuttle engineers were never able to fully solve all the problems the report identified.
Fischbeck’s work reached national prominence again in 2009, when Toyota recalled its Prius due to the risk posed by sticky gas pedals. He showed up on CNBC to put the risk into perspective by showing that driving a recalled Prius for a year, without replacing the gas pedal, was about as risky as walking 10 miles, getting a chest X-ray, working as a police officer for two and a half days, or (the old risk comparison standby) getting struck by lightning.
Recently, Fishbeck’s work has steered toward the hotly contested and data-rich field of health policy. He and his students are about to unveil “Weigh Too Much Information,” a tool for analyzing the risks associated with obesity, broken down by factors such as age and gender. A few years ago, he spearheaded a similar online tool called “Death Risk Rankings,” where users could enter their demographic information and find the probability that they would die of various diseases, accidents, and crimes within a given window of time. The site quickly got 3 million hits, exceeding Carnegie Mellon’s monthly bandwidth limit in a day before crashing. “I was just running it off of this,” explains Fischbeck casually, giving the CPU under his desk a gentle kick.
While health work consumes much of his time of late, his bugaboo on the side is climate science and its policy applications—though, since his research focus is elsewhere and time is limited, he hasn’t published any of his critiques in the climate literature. Still, his engagement with the climate policy question offers insight into the thoughts of the small minority of scientists who dispute climate change and shows how tools for dealing with everyday uncertainties may not apply to questions on how to manage climate change.
To illustrate part of his frustration with the way climate science and policy are often connected by those who enthusiastically support climate policy, Fischbeck pulls up a YouTube video on his screen. It’s called “Please Help the World.” The video was played in Copenhagen in 2009 at the opening of the annual international climate conferences organized by the United Nations.
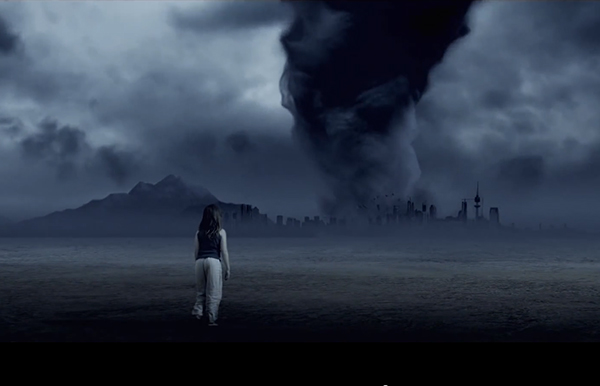
“Please Help the World” video. Click image to view.
In the video, a crack in the ground spreads across a dead landscape, chasing a little girl. She drops her stuffed polar bear, and the crack swallows it. The girl struggles to reach the bear. The sky above her darkens, and a massive tornado forms right above a city in the background.
Then, waves start to engulf the girl from all sides. She scurries to a tree and barely clings to one of its branches as the water roils below. Violins swell in the background.
Fischbeck can’t take it anymore. He closes the tab, silencing the violins and cutting off the film just before the scene is revealed to be a dream sequence.
“This is wrong. This is ethically wrong. It makes you wonder: what must have transpired to get educated, reasonable people to think this was appropriate?” he says, his ire increasing. “It’s tactics like these—you just shoot yourself in the foot.”
As Fishbeck sees it, climate science is hampered by bad risk characterizations due to the frequent underreporting of uncertainty and errors as well as malfeasance on the part of individual scientists. He sees the Copenhagen video as a symptom of the move by climate policy supporters, with scientists among them, who are shifting to “scare” tactics rather than objective analyses. In contrast, Fischbeck says, “What I do is calculate the risk and provide that information for people to make informed decisions.”
“I’m not saying climate change isn’t happening,” he clarifies. “I’m saying you can’t make policy decisions based on shoddy work. If the true uncertainties were known [in climate science], the policy decisions would be different. The policy response should be to get better numbers.”
But, of course, better numbers are what scientists have been pursuing for decades and will continue to pursue as the world continues to warm. While the basic mechanisms and evidence for human-caused climate change are well-established, it’s the details—which often rely on model-based projections far into the future—that are uncertain. And unfortunately, it is precisely such details, on local effects over all time scales, that matter most for policy. Bridging this gap means using scientific models to inform policy in new ways and viewing our current minimal set of policies as just one of many options—perhaps a risky one, at that.
Chapter 6
In November 2007, Fowler was invited to Bozeman, Montana, to give a talk at Montana State University about her work with Archer. Although it was the week before Thanksgiving, with heavy snowfall in the days leading up to the talk, students and faculty still turned out to hear Fowler share the story of her counterintuitive findings. After the talk, students buzzed around Fowler, wanting to know more about a people living in a place that, although distant geographically, was familiar to the students in its ruggedness and the issues it posed; uncertainty about water and the climate is also a reality in the Northern Rockies, where glaciers have disappeared with alarming rapidity and summer streamflows have become highly variable.
When the last student left, Fowler was free to go to her next engagement. This one was a little less formal: her brother Denver happened to be studying paleontology at Montana State and was keen to hear about her work, particularly how the policy and science communities had responded to her results.
As it happened, Fowler had received a very interesting response just five days prior to her trip to Montana. Over the clink of beer glasses at a bar in downtown Bozeman, she related that someone had e-mailed her to tell her that the Heartland Institute, a conservative think tank based in Chicago, had published an op-ed piece in the Chicago Sun Times, citing her work to “prove” the globe wasn’t warming. After a boilerplate introduction, the piece launched into a litany of climate skeptic talking points directed at Al Gore’s An Inconvenient Truth, and Fowler’s research was front and center:
Gore claims that Himalayan glaciers are shrinking and global warming is to blame. Yet the September 2006 issue of the American Meteorological Society’s Journal of Climate reported glaciers are growing in the Himalayan Mountains, confounding global warming alarmists who recently claimed the glaciers were shrinking and that global warming was to blame.
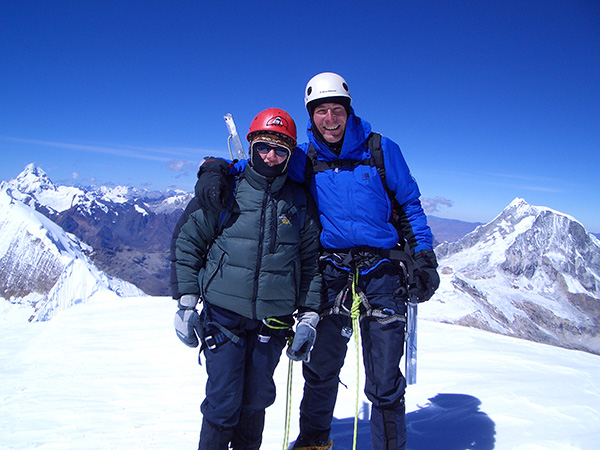
Hayley Fowler on the summit of Tocllaraju, Peru. Image Courtesy of Hayley Fowler.
Denver’s ears perked up at this. He had studied in the United States for a number of years and was aware of the Sun Times’s conservative bent and wide readership. At his behest, Fowler took the piece more seriously and wrote a letter to the editor to set the record straight after she returned to Boulder, Colorado, where she was working as a visiting scientist. The editor published her response, but the damage had already been done. Shortly thereafter, Fowler’s paper from the prestigious Journal of Climate started showing up on recommended skeptic reading lists.
It’s an absurd take on her findings. Glaciers growing in one part of the world don’t disprove the entire theory of climate change, just as a salmon swimming upstream doesn’t disprove the direction of river flow. And, of course, most of the world’s glaciers are shrinking; since 1980, glaciers worldwide have lost more than ten meters of thickness, on average.
Still, the certainty of the overall warming trend for the globe is at odds with our shaky knowledge of the regional effects of climate change, where models are perhaps at their least reliable. In an environment where results on growing glaciers can be twisted into counter-evidence for climate change, “you’ve got to be honest about your science,” Fowler explains before noting that her work in the upper Indus isn’t ammo for skeptics like Fischbeck. That’s because it tells part of a much bigger story about uncertainty in climate science, as a kindred spirit across the Atlantic realizes.
Chapter 7
Near the other end of the worn staircase from Paul Fischbeck’s office is the office of his colleague Granger Morgan. Morgan is the head of Engineering and Public Policy, a department he helped build, which prepares students to work on policy issues like clean energy and cybersecurity, where the engineering details matter.
The two professors’ stances on climate science and policy differ almost as much as their approaches to office decoration.
A bumper sticker on the inside of Morgan’s office door reads Uncertainty Happens, and visitors walking into his office are greeted with the more common academic accoutrements of stacks of journals and framed photos. The books and stacks of paper are tamed in neat piles.
It’s here that Morgan, a grandfatherly but shrewd character who started his career running a computer coding program for underprivileged kids out of the back of a large truck, shares his thoughts on the state of climate science. He’s more sympathetic than Fischbeck to the pressure climate scientists are under. He concedes that they “have been under constant attack, so a few of them have gotten overly rambunctious, but for the most part, the refereed science is very robust.” Reflecting on Fischbeck’s take on climate science, Morgan sees his more excitable colleague as working in “sniper mode.”
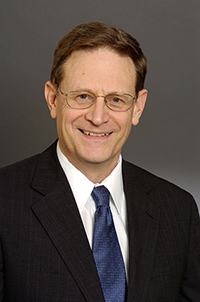
Granger Morgan. Image Courtesy of Carnegie Mellon University.
“Paul is single-mindedly determined to find shoddy work in the climate literature,” Morgan says, firmly but with more resignation than harshness.
The bulk of Morgan’s 1992 book, Uncertainty, is an exhaustive guide for dealing quantitatively with problems like regulating air pollution for public health or tackling ozone-depleting chemicals—problems where the contributing factors are fairly well known and risks can be tamed with probabilities. Only the last few pages of Uncertainty deal with complex models—like climate models—and the problems they address, arguing that “[t]hese models cannot be used to produce precise predictions like those of engineering design models. Rather they provide a vehicle for research on systems we do not yet fully understand. . . . These models are typically not well suited for policy applications.”
These words, written twenty years ago, prefigure Morgan’s reservations about using climate models to directly inform policy. He is particularly wary of regional climate models, which use a process called “downscaling” to take the coarse results of global climate models and tease out their implications for the temperature, rainfall, and other climate phenomena of a specific region. In some sense, accurate downscaling is the Holy Grail of climate modeling: being able to predict exactly where more flooding or more droughts will occur, and what areas will bear the brunt of temperature change, is really the kind of information we need to prepare for change. However, there is no straightforward way to translate the results of global models to this level, leaving downscaled results full of uncertainties in addition to the unavoidable uncertainties in the global results.
“The downscaling guys say, ‘Give me enough computer cycles, and I’ll give you whatever you want,’” Morgan says matter-of-factly. “We’re still orders of magnitude away from policy-relevant downscaling. We probably won’t get policy-relevant results on the timescale of the geophysical experiment we’re doing with the planet. It’s simply inherent to the nature of the problem that there are limits to what models can tell us.” This means scientists like Fowler and Archer have to rely on multiple lines of evidence to support their conclusions on local climate change effects and use models wisely.
Getting as much policy-relevant insight as we can from climate models, Morgan argues, requires using them differently than we might use a model of a relatively small-scale and well-understood problem—the health effects of air pollution, say. Morgan’s point of view, one that is gaining traction in the climate policy world, represents a shift away from how science has informed policy in the past. Analogous to other science policy problems, shaping good climate policies depends on both the available strategies for reducing carbon emissions and the anticipated impact of additional emissions, and it is this second part where climate models play a role. In almost every similar policy, such as those Fischbeck is drawn to, probabilities of bad outcomes help inform the policy decision. For example, health policy makes use of reliable probability estimates of getting lung cancer from living downwind of a coal-fired power plant, which influences policy decisions on pollution regulations and renewable energy subsidies. Probabilities are readily available for these problems because there are many, many instances that give us data on outcomes and because we can assume, at least over the short term, that the future will be similar to the past.
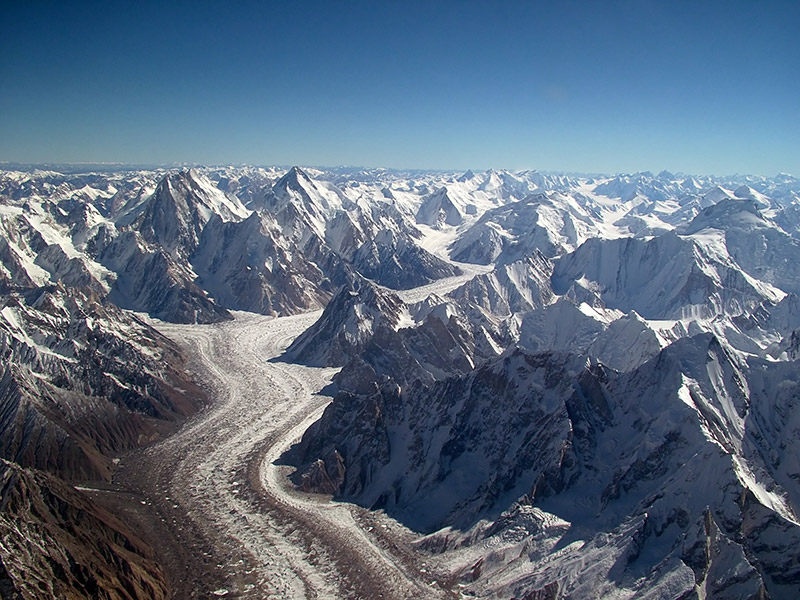
Baltoro Glacier from the air, in the heart of the Karakoram Range in Pakistan.
Climate science is the opposite: there’s only one Earth to observe, and its history may not be a good guide to its future. Humans are responsible for no small part of this type of uncertainty—the future of our energy system, both in how much we use and where we get it, is the biggest factor in determining our effect on climate. In the past, this human aspect has been notoriously hard to predict.
Morgan explains his alternate view of how models can inform policy: “We all have a strong desire to work in the direction of causal influences, from emissions to impacts. However, there is often so much uncertainty in the earlier steps that if we are honest, we get probability distributions on the latter stages that are so broad as to be almost useless. Sometimes a better strategy is to ask what possible outcomes might we most care about and then work backward to ask what sorts of things would have to happen to lead to those outcomes.”
Fowler agrees this approach could alleviate some of the issues inherent in modeling even if it doesn’t completely weed out uncertainty. In the Karakoram, that might mean imagining a whole range of futures given its current state.
The level at which we best understand climate change—that is, globally—is drastically mismatched to the local and regional effects that are most relevant to decision making.
Climate change has a convergence of attributes the policy world has never seen. The effects of greenhouse gas emissions are global, not limited to the area around the emissions source. The effects of current pollution will be felt for many generations into the far future, with our imaginations of what that world will look like flickering out long before the effects of our fossil fuel use dissipate. The level at which we best understand climate change—that is, globally—is drastically mismatched to the local and regional effects that are most relevant to decision making. The science is rife with what scientists have begun to call “deep uncertainty,” or uncertainty about important processes of which we are unaware, which is in essence unquantifiable.
Fischbeck mocks “this idea of deep uncertainty,” implying that those who invoke it are somehow too gutless or convoluted in their thinking to put forth best estimates and uncertainty bounds. For Morgan, however, it adds to the characterization of climate change as a different species of problem, one that requires a rethinking of how science and models inform policy. While scientists have come to expect direct risk estimates from models, the most that current climate models can do is offer insight into qualitative trends and serve as a tool to help us understand what would have to take place to result in outcomes that as a society we want to avoid. While these tools are far from ideal, accepting Morgan’s shift in thinking, they are a lot.
Chapter 8
That’s where Fowler sees her work with Archer in the Indus going. It’s an evolving process focused on the near-term as well as the long-term future of the region’s water. They’re able to offer summer water inflow predictions at the Indus’s two biggest
reservoirs as early as March. While they had hoped for the water management agencies in the Indus basin to pick up these forecasts and use them to better manage irrigation, that hasn’t been the case.
“There are problems with the different departments sharing information,” Archer muses. “It’s a management problem rather than a technical problem.”
They’re also finding clarity in the bigger picture issue of what’s behind the bigger picture mystery of the stagnant glaciers. Fowler and Archer have used recent data from satellites to get a better understanding of the drivers of the present climate of the upper Indus, particularly the summer cooling. Early signs point to cloud cover and the reflectivity of fresh snow as two big factors. Climate phenomena in other parts of the world—in particular, air flows all the way from the western Atlantic—are also part of the puzzle.
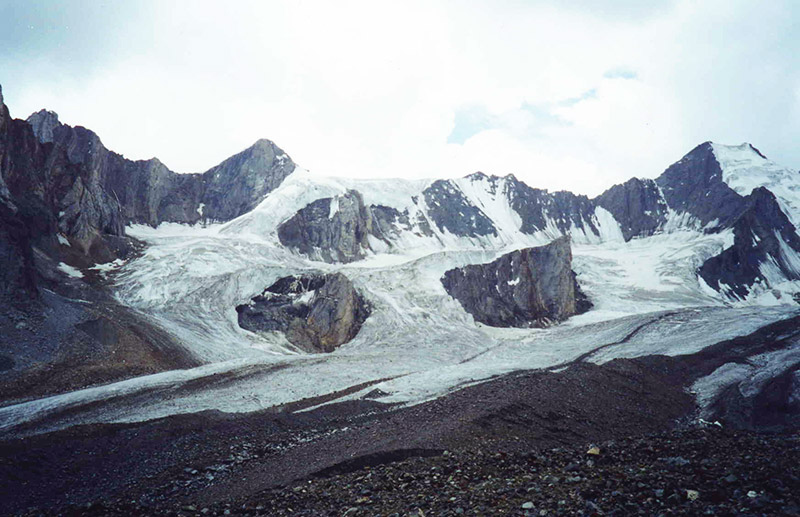
Basho Sarfulisa Glacier. Image Courtesy David Archer.
Both Fowler and Archer could probably make careers out of chasing the other parts and modeling the future of the region. Increasingly, though, what gets Fowler up in the morning is working with both scientists and policy makers to clarify the perception of models and their uses. Her work with Archer in the Karakoram is only one piece in a much bigger puzzle that will determine our future.
“Climate models originally were intended to be used to investigate processes, and now they’re misused in a lot of ways. One of those is trying to use them to find specific information on impacts at short time and space scales,”she says.
This muddying of the role of climate models has contributed to confusion about what exactly they can and can’t tell us, in turn contributing to a stall in rational policy discussion amongst experts like Fischbeck and Morgan, and, perhaps more importantly, among water managers in the upper Indus and other parts of the world. Still, this view has to be balanced with a growing demand to know what the future looks like.
“Climate models, whether I like it or not, are the best game in town to look at the future, but the way we do it at the moment is not very intelligent or useful,” Fowler says. “I think models do have a place; it’s in understanding processes and using an understanding of model deficiencies to develop intelligent downscaling methods or information on which to make decisions.
“This is the idea of putting the decision first: thinking about options and looking for scenarios that are relevant to the decision,” she explains. “We need a paradigm shift in thinking, but the climate scientists need to get on board—we should not just be interested in processes. We need to rethink our use of models and how we focus climate model experiments—around important decisions would be a pretty neat idea.”
That doesn’t mean models will provide all the answers for decision makers. Rather than waiting for the perfect model (which will never exist anyway), decision makers in the Karakoram region or other parts of the world can plan for a range of outcomes and understand the level of risk they feel comfortable with. Models can provide some kind of guidance on what the future might hold, but they’ll never provide a perfect answer to make a perfect decision. As we do every day, we will have to make decisions without knowing exactly what will result from them. But with climate, doing nothing may be the riskiest option of all.